Achieving the Dream at BCC

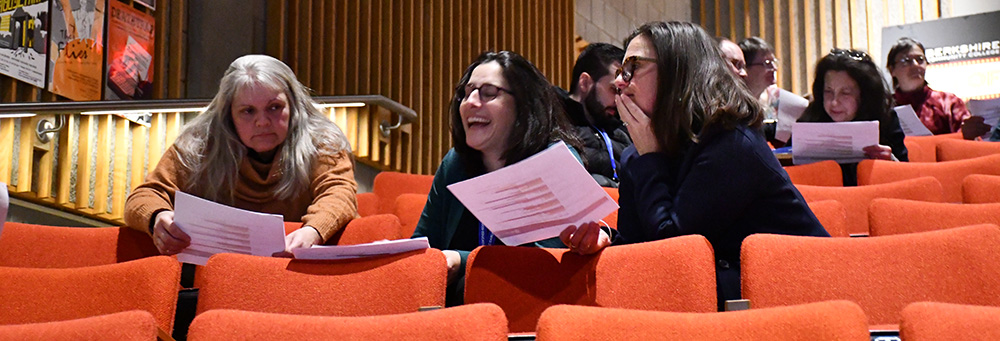
Achieving the Dream - STEM Starter Academy students at BCC

Welcome!

Thirteen members of the Berkshire Community College (BCC) faculty, staff, and Administration joined thousands of influential leaders, scholars and practitioners from more than 300 colleges and organizations at Achieving the Dream (ATD)'s 18th annual signature event, DREAM 2022. ATD's immersive virtual experience provides interactive learning and key insights about evidence-based reform strategies that are transforming higher education.

DREAM 2022 centered on five key themes that represent opportunities to effect meaningful change in our communities.

  • Building stronger pipelines to and through postsecondary education.
  • Adopting a holistic, equity-focused approach to community vitality.
  • Eliminating systemic barriers to student success.
  • Fostering a sense of belonging through teaching and learning excellence.
  • Leveraging data and analytics for institutional and community well-being.

The BCC CORE Team finalized our 2022 ATD Action Plan (PDF). The plan is grounded in Student Success strategies that cut across both Academic and Student Affairs and focus on individualized student support, goal setting for future academic pursuit and career exploration, and skill development for the citizenship in the future. The ATD Data teams focused work has informed planning, goals setting, and strategic thinking and the plan will align with the BCC strategic plan.

BCC ATD Action Plan (PDF)

Contact Us

Adam Klepetar, Vice President for Student Affairs and Enrollment Management
aklepetar@berkshirecc.edu
413-236-2140

Laurie Gordy, Interim Vice President for Academic Affairs
lgordy@berkshirecc.edu
413-236-2103
ATD logo

Achieving the Dream and BCC

Conceived in 2004, Achieving the Dream (ATD) now leads the most comprehensive non-governmental reform movement for student success in higher education history, and its efforts are gaining attention.

ATD accepts grant applications from community colleges; recently, BCC won a grant to become part of an ATD cohort called Building Resiliency in Rural Communities for the Future of Work.

2022 Rural Resiliency Cohort Annual Reflection (DOC)

Nearly half of all students seeking higher education choose a community college. Fewer than half of those students actually finish what they start. ATD, a national program that partners with more than 300 community colleges, including BCC, is determined to change that statistic.

BCC was a successful candidate due to its committed leadership, its equity goals aligned with those of the grant and ATD, and its preparation of a compelling argument for inclusion.

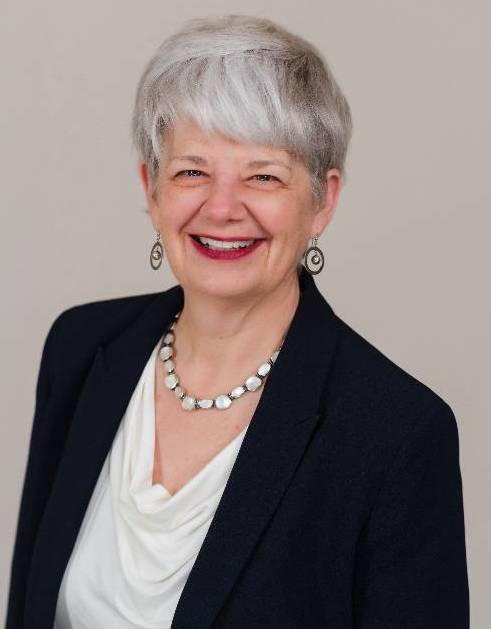
Dr. Mary E. Ostrye, a consultant to ATD.

Read more about ATD and BCC from the 2021 Press Release

ATD at BCC Initiatives

  • BCC Announces New Liberal Arts Course

    BCC announces the creation of Introduction to Liberal Arts, a first-semester course available this fall for all students declaring liberal arts majors without concentrations.

    With a focus on career and educational planning, the course engages students in thinking critically about their academic and/or career plans. Faculty involved in developing course content represent a range of liberal arts disciplines, including communications, biology, music, psychology, English and math.

  • BCC Announces New SUCCESS Program

    BCC was pleased to announce it has received an allocation of $869,377 from the state legislature as part of a $16 million fund distributed to all 15 community colleges in the Commonwealth. The allocation is earmarked for the Supporting Urgent Community College Equity through Student Services (SUCCESS) Fund, which focuses on vulnerable populations.

    Check out the SUCCESS funding press release

    Visit Academic SUCCESS Coach

BCC's Data for ATD:

First-time-ever-in-college (FTEIC): All full-time and part-time students who are enrolled for the first time in postsecondary education (no previous college credits or degrees) in at least one credit-bearing course (including developmental courses but excluding other non-credit offerings) at the College in the given fall term. Students who were dually enrolled at your college and in high school are excluded.

Sharing Five Central Goals and Outcomes of ATD Project:

  • Create a student success vision statement
  • Build a data-informed culture of inquiry across the college; leverage PDP
  • Identify equity gaps for low-income, first generation, BIPOC students and create plan to close gaps
  • Identify and cultivate more strategic partnerships
  • Prepare students for the "future of work," with an emphasis on the "digital economy" and living wage jobs

Click the graphs below for more information:

zero credits Early Momentum Metrics math Persistence Metrics persistence Completion Metrics
  • Early Momentum Metrics: Are First-time-ever-in-college students engaging with the college and starting off strongly?
    Cohort Fall 2016 Fall 2017 Fall 2018 Fall 2019 Fall 2020
    N % N % N % N % N %
    Total FTEIC Students (denominators)
    Overall 530 515 461 493 364
    Age
    Under 20 years 323 339 302 340 272
    20 – 24 years 95 76 60 57 46
    Over 24 years 112 100 99 96 46
    Enrollment Status
    Full-Time 189 206 156 155 112
    Part-Time 341 309 305 338 252
    Ethnicity
    American Indian/Alaska Native 6 5 1 5 1
    Asian 8 12 5 7 6
    Black 29 31 32 26 24
    Hispanic 37 40 39 51 44
    Multiracial 11 13 24 27 13
    Pacific Islander 1 1 1 0 0
    White 414 366 314 326 242
    Unknown or Other Ethnicity 24 47 45 51 34
    Gender
    Female 320 306 283 269 209
    Male 210 203 166 207 147
    Unknown or Other Gender 0 6 12 17 8
    Pell Status
    Pell Recipient 218 240 174 189 106
    Non-Pell Recipient 312 275 287 304 258
    Students earning zero credits (only F and W grades) in the first semester
    Overall 73 14% 78 15% 63 14% 82 17% 89 24%
    Age
    Under 20 years 44 14% 44 13% 36 12% 48 14% 75 28%
    20 – 24 years 14 15% 15 20% 12 20% 13 23% 8 17%
    Over 24 years 15 13% 19 19% 15 15% 21 22% 6 13%
    Enrollment Status
    Full-Time 27 14% 31 15% 18 12% 31 20% 31 28%
    Part-Time 46 13% 47 15% 45 15% 51 15% 58 23%
    Ethnicity
    American Indian/Alaska Native 0 0% 0 0% 0 0% 2 40% 0 0%
    Asian 1 13% 1 8% 0 0% 0 0% 1 17%
    Black 11 38% 11 35% 4 13% 11 42% 10 42%
    Hispanic 5 14% 8 20% 9 23% 13 25% 17 39%
    Multiracial 2 18% 3 23% 4 17% 8 30% 6 46%
    Pacific Islander 0 0% 0 0% 0 0% 0 n/a 0 n/a
    White 53 13% 49 13% 38 12% 44 13% 48 20%
    Unknown or Other Ethnicity 1 4% 6 13% 8 18% 4 8% 7 21%
    Gender
    Female 34 11% 41 13% 40 14% 41 15% 44 21%
    Male 39 19% 37 18% 20 12% 41 20% 44 30%
    Unknown or Other Gender 0 n/a 0 0% 3 25% 0 0% 1 13%
    Pell Status
    Pell Recipient 38 17% 43 18% 25 14% 46 24% 30 28%
    Non-Pell Recipient 35 11% 35 13% 38 13% 36 12% 59 23%
    Students earning at least 12 credits in the first semester
    Overall 111 21% 118 23% 83 18% 78 16% 56 15%
    Age
    Under 20 years 78 24% 91 27% 57 19% 62 18% 43 16%
    20 – 24 years 20 21% 11 14% 16 27% 8 14% 8 17%
    Over 24 years 13 12% 16 16% 10 10% 8 8% 5 11%
    Enrollment Status
    Full-Time 111 59% 118 57% 83 53% 78 50% 56 50%
    Part-Time 0 0% 0 0% 0 0% 0 0% 0 0%
    Ethnicity
    American Indian/Alaska Native 1 17% 1 20% 0 0% 3 60% 0 0%
    Asian 2 25% 4 33% 0 0% 0 0% 0 0%
    Black 5 17% 8 26% 6 19% 2 8% 2 8%
    Hispanic 6 16% 9 23% 7 18% 6 12% 5 11%
    Multiracial 2 18% 1 8% 2 8% 3 11% 3 23%
    Pacific Islander 0 0% 1 100% 1 100% 0 n/a 0 n/a
    White 94 23% 90 25% 60 19% 58 18% 39 16%
    Unknown or Other Ethnicity 1 4% 4 9% 7 16% 6 12% 7 21%
    Gender
    Female 61 19% 70 23% 43 15% 38 14% 28 13%
    Male 50 24% 48 24% 38 23% 37 18% 28 19%
    Unknown or Other Gender 0 n/a 0 0% 2 17% 3 18% 0 0%
    Pell Status
    Pell Recipient 59 27% 65 27% 44 25% 38 20% 27 25%
    Non-Pell Recipient 52 17% 53 19% 39 14% 40 13% 29 11%
    Students earning at least 15 credits in the first year
    Overall 164 31% 183 36% 126 27% 128 26% 0%
    Age
    Under 20 years 107 33% 116 34% 80 26% 88 26% 0%
    20 – 24 years 32 34% 30 39% 22 37% 11 19% 0%
    Over 24 years 25 22% 37 37% 24 24% 29 30% 0%
    Enrollment Status
    Full-Time 122 65% 128 62% 92 59% 89 57% 0%
    Part-Time 42 12% 55 18% 34 11% 39 12% 0%
    Ethnicity
    American Indian/Alaska Native 2 33% 2 40% 0 0% 2 40% 0%
    Asian 3 38% 7 58% 0 0% 1 14% 0%
    Black 5 17% 11 35% 9 28% 5 19% 0%
    Hispanic 8 22% 12 30% 15 38% 9 18% 0%
    Multiracial 2 18% 2 15% 4 17% 8 30% 0%
    Pacific Islander 0 0% 1 100% 1 100% 0 n/a n/a
    White 139 34% 139 38% 88 28% 93 29% 0%
    Unknown or Other Ethnicity 5 21% 9 19% 9 20% 10 20% 0%
    Gender
    Female 97 30% 105 34% 67 24% 71 26% 0%
    Male 67 32% 78 38% 57 34% 51 25% 0%
    Unknown or Other Gender 0 n/a 0 0% 2 17% 6 35% 0%
    Pell Status
    Pell Recipient 85 39% 106 44% 68 39% 62 33% 0%
    Non-Pell Recipient 79 25% 77 28% 58 20% 66 22% 0%
    Students earning a cumulative GPA of 2.0 in the first year: First Semester
    Overall 348 66% 331 64% 295 64% 300 61% 213 59%
    Age
    Under 20 years 209 65% 219 65% 193 64% 216 64% 154 57%
    20 – 24 years 60 63% 43 57% 33 55% 27 47% 28 61%
    Over 24 years 79 71% 69 69% 69 70% 57 59% 31 67%
    Enrollment Status
    Full-Time 108 57% 144 70% 83 53% 71 46% 52 46%
    Part-Time 240 70% 187 61% 212 70% 229 68% 161 64%
    Ethnicity
    American Indian/Alaska Native 2 33% 3 60% 1 100% 3 60% 0 0%
    Asian 7 88% 11 92% 4 80% 6 86% 3 50%
    Black 11 38% 17 55% 20 63% 7 27% 7 29%
    Hispanic 21 57% 24 60% 20 51% 30 59% 19 43%
    Multiracial 5 45% 7 54% 11 46% 8 30% 6 46%
    Pacific Islander 1 100% 1 100% 1 100% 0 n/a 0 n/a
    White 280 68% 239 65% 213 68% 209 64% 153 63%
    Unknown or Other Ethnicity 21 88% 29 62% 25 56% 37 73% 25 74%
    Gender
    Female 228 71% 186 61% 187 66% 172 64% 133 64%
    Male 120 57% 140 69% 100 60% 115 56% 75 51%
    Unknown or Other Gender 0 n/a 5 83% 8 67% 13 76% 5 63%
    Pell Status
    Pell Recipient 113 52% 152 63% 95 55% 78 41% 48 45%
    Non-Pell Recipient 235 75% 179 65% 200 70% 222 73% 165 64%
  • Persistence Metrics: Are First-time-ever-in-college students getting and staying on pathways and building additional momentum?
    Cohort Fall 2016 Fall 2017 Fall 2018 Fall 2019 Fall 2020
      N % N % N % N % N %
    Total FTEIC Students (denominators)
    Overall 530 515 461 493 364
    Age
    Under 20 years 323 339 302 340 272
    20 – 24 years 95 76 60 57 46
    Over 24 years 112 100 99 96 46
    Enrollment Status
    Full-Time 189 206 156 155 112
    Part-Time 341 309 305 338 252
    Ethnicity
    American Indian/Alaska Native 6 5 1 5 1
    Asian 8 12 5 7 6
    Black 29 31 32 26 24
    Hispanic 37 40 39 51 44
    Multiracial 11 13 24 27 13
    Pacific Islander 1 1 1 0 0
    White 414 366 314 326 242
    Unknown or Other Ethnicity 24 47 45 51 34
    Gender
    Female 320 306 283 269 209
    Male 210 203 166 207 147
    Unknown or Other Gender 0 6 12 17 8
    Pell Status
    Pell Recipient 218 240 174 189 106
    Non-Pell Recipient 312 275 287 304 258
    Completed first college-level Math in the first year (FTEIC): First Semester
    Overall 140 26% 130 25% 97 21% 93 19% 49 13%
    Age
    Under 20 years 98 30% 98 29% 76 25% 74 22% 40 15%
    20 – 24 years 21 22% 15 20% 9 15% 6 11% 6 13%
    Over 24 years 21 19% 17 17% 12 12% 13 14% 3 7%
    Enrollment Status
    Full-Time 88 47% 87 42% 54 35% 50 32% 31 28%
    Part-Time 52 15% 43 14% 43 14% 43 13% 18 7%
    Ethnicity
    American Indian/Alaska Native 1 17% 1 20% 1 100% 0 0% 0 0%
    Asian 4 50% 5 42% 1 20% 2 29% 1 17%
    Black 5 17% 8 26% 3 9% 3 12% 3 13%
    Hispanic 9 24% 13 33% 8 21% 7 14% 3 7%
    Multiracial 1 9% 2 15% 1 4% 5 19% 1 8%
    Pacific Islander 0 0% 0 0% 1 100% 0 n/a 0 n/a
    White 115 28% 96 26% 75 24% 69 21% 32 13%
    Unknown or Other Ethnicity 5 21% 5 11% 7 16% 7 14% 9 26%
    Gender
    Female 84 26% 84 27% 58 20% 49 18% 22 11%
    Male 56 27% 46 23% 39 23% 39 19% 27 18%
    Unknown or Other Gender 0 n/a 0 0% 0 0% 5 29% 0 0%
    Pell Status
    Pell Recipient 62 28% 72 30% 43 25% 42 22% 18 17%
    Non-Pell Recipient 78 25% 58 21% 54 19% 51 17% 31 12%
    Completed first college-level English in the first year (FTEIC): First Semester
    Overall 241 45% 246 48% 229 50% 202 41% 97 27%
    Age
    Under 20 years 163 50% 169 50% 162 54% 149 44% 68 25%
    20 – 24 years 41 43% 39 51% 27 45% 21 37% 16 35%
    Over 24 years 37 33% 38 38% 40 40% 32 33% 13 28%
    Enrollment Status
    Full-Time 123 65% 136 66% 108 69% 99 64% 57 51%
    Part-Time 118 35% 110 36% 121 40% 103 30% 40 16%
    Ethnicity
    American Indian/Alaska Native 2 33% 3 60% 0 0% 2 40% 0 0%
    Asian 5 63% 8 67% 4 80% 3 43% 2 33%
    Black 8 28% 18 58% 15 47% 8 31% 4 17%
    Hispanic 16 43% 22 55% 24 62% 21 41% 11 25%
    Multiracial 3 27% 3 23% 14 58% 10 37% 3 23%
    Pacific Islander 1 100% 0 0% 1 100% 0 n/a 0 n/a
    White 197 48% 176 48% 153 49% 142 44% 61 25%
    Unknown or Other Ethnicity 9 38% 16 34% 18 40% 16 31% 16 47%
    Gender
    Female 138 43% 152 50% 135 48% 122 45% 51 24%
    Male 103 49% 93 46% 91 55% 75 36% 46 31%
    Unknown or Other Gender 0 n/a 1 17% 3 25% 5 29% 0 0%
    Pell Status
    Pell Recipient 120 55% 150 63% 115 66% 92 49% 46 43%
    Non-Pell Recipient 121 39% 96 35% 114 40% 110 36% 51 20%
    Students earning at least 30 credits in the first year
    Overall 33 6% 40 8% 26 6% 13 3% 0%
    Age
    Under 20 years 20 6% 28 8% 15 5% 11 3% 0%
    20 – 24 years 7 7% 6 8% 5 8% 1 2% 0%
    Over 24 years 6 5% 6 6% 6 6% 1 1% 0%
    Enrollment Status
    Full-Time 31 16% 37 18% 25 16% 13 8% 0%
    Part-Time 2 1% 3 1% 1 0% 0 0% 0%
    Ethnicity
    American Indian/Alaska Native 0 0% 0 0% 0 0% 0 0% 0%
    Asian 0 0% 2 17% 0 0% 0 0% 0%
    Black 2 7% 3 10% 4 13% 1 4% 0%
    Hispanic 1 3% 1 3% 2 5% 1 2% 0%
    Multiracial 1 9% 1 8% 1 4% 0 0% 0%
    Pacific Islander 0 0% 1 100% 0 0% 0 n/a n/a
    White 29 7% 30 8% 17 5% 11 3% 0%
    Unknown or Other Ethnicity 0 0% 2 4% 2 4% 0 0% 0%
    Gender
    Female 18 6% 20 7% 13 5% 5 2% 0%
    Male 15 7% 20 10% 13 8% 8 4% 0%
    Unknown or Other Gender 0 n/a 0 0% 0 0% 0 0% 0%
    Pell Status
    Pell Recipient 16 7% 23 10% 12 7% 7 4% 0%
    Non-Pell Recipient 17 5% 17 6% 14 5% 6 2% 0%
    Students re-enrolling in the FOLLOWING fall semester (one-year fall-to-fall retention)
    Overall 205 39% 205 40% 161 35% 141 29% 0%
    Age
    Under 20 years 123 38% 125 37% 106 35% 99 29% 0%
    20 – 24 years 41 43% 29 38% 19 32% 14 25% 0%
    Over 24 years 41 37% 51 51% 36 36% 28 29% 0%
    Enrollment Status
    Full-Time 104 55% 112 54% 71 46% 61 39% 0%
    Part-Time 101 30% 93 30% 90 30% 80 24% 0%
    Ethnicity
    American Indian/Alaska Native 3 50% 1 20% 1 100% 1 20% 0%
    Asian 5 63% 7 58% 2 40% 1 14% 0%
    Black 10 34% 17 55% 14 44% 7 27% 0%
    Hispanic 10 27% 14 35% 14 36% 19 37% 0%
    Multiracial 3 27% 1 8% 7 29% 5 19% 0%
    Pacific Islander 1 100% 0 0% 1 100% 0 n/a n/a
    White 168 41% 157 43% 105 33% 98 30% 0%
    Unknown or Other Ethnicity 5 21% 8 17% 17 38% 10 20% 0%
    Gender
    Female 116 36% 119 39% 95 34% 83 31% 0%
    Male 89 42% 86 42% 65 39% 53 26% 0%
    Unknown or Other Gender 0 n/a 0 0% 1 8% 5 29% 0%
    Pell Status
    Pell Recipient 105 48% 120 50% 85 49% 67 35% 0%
    Non-Pell Recipient 100 32% 85 31% 76 26% 74 24% 0%
    Number of Credits Attempted in the first year (denominators for Credits Completed): First Semester
    Overall 7,662 7,751 6,197 6,331 2,852
    Age
    Under 20 years 4,664 5,115 3,903 4,295 2,071
    20 – 24 years 1,570 1,165 1,005 777 415
    Over 24 years 1,428 1,471 1,289 1,259 366
    Enrollment Status
    Full-Time 4,610 4,888 3,687 3,555 1,572
    Part-Time 3,052 2,863 2,510 2,776 1,280
    Ethnicity
    American Indian/Alaska Native 95 77 4 89 3
    Asian 144 236 41 53 47
    Black 418 539 512 349 197
    Hispanic 480 577 647 572 361
    Multiracial 141 151 340 377 102
    Pacific Islander 15 38 36 0 0
    White 6,167 5,684 4,066 4,315 1,883
    Unknown or Other Ethnicity 202 449 551 576 259
    Gender
    Female 4,339 4,351 3,550 3,392 1,566
    Male 3,323 3,382 2,558 2,729 1,249
    Unknown or Other Gender 0 18 89 210 37
    Pell Status
    Pell Recipient 3,920 4,451 3,132 3,089 1,145
    Non-Pell Recipient 3,742 3,300 3,065 3,242 1,707
    Number of Credits Completed in the first year: First Semester
    Overall 5,832 76% 5,863 76% 4,744 77% 4,575 72% 1,767 62%
    Age
    Under 20 years 3,567 76% 3,752 73% 2,939 75% 3,147 73% 1,222 59%
    20 – 24 years 1,175 75% 904 78% 749 75% 517 67% 280 67%
    Over 24 years 1,090 76% 1,207 82% 1,056 82% 911 72% 265 72%
    Enrollment Status
    Full-Time 3,498 76% 3,642 75% 2,793 76% 2,454 69% 892 57%
    Part-Time 2,334 76% 2,221 78% 1,951 78% 2,121 76% 875 68%
    Ethnicity
    American Indian/Alaska Native 62 65% 66 86% 4 100% 64 72% 3 100%
    Asian 124 86% 213 90% 31 76% 50 94% 29 62%
    Black 256 61% 328 61% 391 76% 182 52% 96 49%
    Hispanic 316 66% 401 69% 470 73% 413 72% 170 47%
    Multiracial 79 56% 87 58% 195 57% 224 59% 55 54%
    Pacific Islander 12 80% 38 100% 25 69% 0 n/a 0 n/a
    White 4,797 78% 4,382 77% 3,199 79% 3,220 75% 1,213 64%
    Unknown or Other Ethnicity 186 92% 348 78% 429 78% 422 73% 201 78%
    Gender
    Female 3,459 80% 3,408 78% 2,725 77% 2,492 73% 987 63%
    Male 2,373 71% 2,437 72% 1,948 76% 1,913 70% 758 61%
    Unknown or Other Gender 0 n/a 18 100% 71 80% 170 81% 22 59%
    Pell Status
    Pell Recipient 2,800 71% 3,181 71% 2,313 74% 1,937 63% 676 59%
    Non-Pell Recipient 3,032 81% 2,682 81% 2,431 79% 2,638 81% 1,091 64%
  • Completion Metrics: Are First-time-ever-in-college students completing a credential?
    Cohort Fall 2011 Fall 2012 Fall 2013 Fall 2014
      N % N % N % N %
    Total FTEIC Students (denominators)
    Overall 778 748 720 602
    Age
    Under 20 years 499 496 461 413
    20 – 24 years 124 84 96 76
    Over 24 years 155 168 163 113
    Enrollment Status
    Full-Time 349 304 291 242
    Part-Time 429 444 429 360
    Ethnicity
    American Indian/Alaska Native 4 2 1 2
    Asian 19 19 16 13
    Black 40 41 39 39
    Hispanic 47 50 44 46
    Multiracial 18 30 11 13
    Pacific Islander 1 0 1 2
    White 622 574 572 452
    Unknown or Other Ethnicity 27 32 36 35
    Gender
    Female 411 400 423 342
    Male 367 348 297 260
    Unknown or Other Gender 0 0 0 0
    Pell Status
    Pell Recipient 419 387 342 321
    Non-Pell Recipient 359 361 378 281
    Completion of a certificate or degree within four years
    Overall 124 16% 103 14% 122 17% 92 15%
    Age
    Under 20 years 81 16% 58 12% 84 18% 62 15%
    20 – 24 years 20 16% 12 14% 10 10% 12 16%
    Over 24 years 23 15% 33 20% 28 17% 18 16%
    Enrollment Status
    Full-Time 87 25% 65 21% 85 29% 58 24%
    Part-Time 37 9% 38 9% 37 9% 34 9%
    Ethnicity
    American Indian/Alaska Native 1 25% 0 0% 0 0% 0 0%
    Asian 2 11% 4 21% 1 6% 1 8%
    Black 2 5% 6 15% 5 13% 7 18%
    Hispanic 6 13% 4 8% 7 16% 7 15%
    Multiracial 1 6% 3 10% 2 18% 0 0%
    Pacific Islander 1 100% 0 n/a 0 0% 0 0%
    White 109 18% 84 15% 103 18% 73 16%
    Unknown or Other Ethnicity 2 7% 2 6% 4 11% 4 11%
    Gender
    Female 71 17% 58 15% 63 15% 54 16%
    Male 53 14% 45 13% 59 20% 38 15%
    Unknown or Other Gender 0 0 0 0 0 0 0 0
    Pell Status
    Pell Recipient 71 17% 52 13% 68 20% 53 17%
    Non-Pell Recipient 53 15% 51 14% 54 14% 39 14%
    Transferred and completed a baccalaureate degree within six years
    Overall 144 19% 149 20% 166 23% 127 21%
    Age
    Under 20 years 123 25% 115 23% 132 29% 101 24%
    20 – 24 years 11 9% 17 20% 21 22% 17 22%
    Over 24 years 10 6% 17 10% 13 8% 9 8%
    Enrollment Status
    Full-Time 63 18% 62 20% 57 20% 49 20%
    Part-Time 81 19% 87 20% 109 25% 78 22%
    Ethnicity
    American Indian/Alaska Native 1 25% 0 0% 0 0% 0 0%
    Asian 7 37% 7 37% 8 50% 2 15%
    Black 3 8% 3 7% 3 8% 2 5%
    Hispanic 1 2% 5 10% 9 20% 7 15%
    Multiracial 4 22% 2 7% 1 9% 0 0%
    Pacific Islander 1 100% 0 n/a 1 100% 1 50%
    White 117 19% 118 21% 134 23% 105 23%
    Unknown or Other Ethnicity 4 15% 14 44% 10 28% 10 29%
    Gender
    Female 78 19% 79 20% 106 25% 86 25%
    Male 66 18% 70 20% 60 20% 41 16%
    Unknown or Other Gender 0 0 0 0 0 0 0 0
    Pell Status
    Pell Recipient 38 9% 38 10% 33 10% 42 13%
    Non-Pell Recipient 106 30% 111 31% 133 35% 85 30%

Institutional Capacity Assessement Tool

The Achieving the Dream Institutional Capacity Assessment Tool is an online self-assessment to help colleges assess areas of strength and improvement in the Institutional Capacity Framework. Institutions may also use the tool to measure changes in capacity over time.

The purpose of this Results Summary is to display the aggregated responses from all college participants and disaggregated results by functional area and role to identify areas where there is a convergence or divergence of opinion. The results may be used for individual reflection and as a springboard for campus conversations on overarching themes, strengths to celebrate or build on, opportunities to
build, and actions to build capacity.

View the Results Summary (PDF)

In addition, the completion of the self-assessment allows Board members, administrators, faculty and staff to evaluate their institution's level of capacity in relation to what improved capacity could look like.

View the Response Distribution Summary (PDF)

ATD Virtual Visit I Capacity Cafe

ATD Success Stories from Northern Essex Community College (NECC):

  • Four takeaways from NECC's work with ATD

    The following are testimonials from the team that worked on the Northern Essex Community College Achieving the Dream work in 2006:

    First, one enormous benefit of ATD is the sheer size and scope of the network, and how easily it can be leveraged for professional collaborations. For example, through the ATD coaches NECC was able to connect with some folks from Southwestern Tennessee CC earlier this year to deliver our Professional Day programming on racial equity gaps. They provided opportunities for both Academic and Student Affairs to participate in the conversation, too, which was really powerful.
    • Second, the coaches have been an integral part of NECC's work. They have two ATD coaches who each bring a slightly different lens of expertise. One is their data coach, and she has helped us to identify metrics for student success, use metrics and data to design, guide, and measure initiatives, and has helped lead campus groups through data discussions that would otherwise have been difficult to have on our own. The other coach has really helped guide some of NECC's professional learning, especially around equity, and continues to help us identify ways to support faculty and staff. This data focus was especially important in creating and progressing NECC's Integrated Student Experience strategic goal work over the last five years.
    • Third, adding to the data piece, the relationship with ATD is what has allowed NECC to make so much progress with equity data dashboards, including being able to have conversations with faculty about their individual course completion data. Without the coaches' help and years of support to become a data-driven campus, NECC would not be where they are with our data work. The coaches had helped NECC be a college that can and does talk about data from an informed perspective (qualitative and quantitative), which was a really necessary foundation for being able to add the equity perspective in 2019.
    • Finally, we also want BCC to know how amazing the tools, conferences, and networking opportunities are. Obviously, we, at NECC, have had our own things (data, the Integrated Student Experience as a strategic goal, etc.) but all of that started and has grown because of the resources available through the annual conference. Because of ATDs size, they can attract impactful keynote speakers and presenters, and the size of the network means you can hear from other colleges all over the country doing just about anything you might be thinking of starting up at BCC.
  • A brief summary of the ATD work at NECC
    From our work with ATD, NECC has gained the resources, support, and knowledge we need to make impactful changes in student success work on our campus, and we have continually seen that work make a difference in our students' academic lives. We have learned to use data for strategic insights from our knowledgeable coaches; we have built collaborative working relationships with colleagues from other network colleges; and the ever-grown body of resources available through the ATD conferences and online toolkits helps us continue to grow our internal expertise.

DRAFT Mission Statement for Student Success:

At BCC, student success is the heart of everything we do. From connection to completion, and at each step along the way, we will guide and assist you in exploring and attaining your academic and career goals. Through integrated academic and support services across the college experience, and clear, concise academic pathways that align to you interests and aspiration. We believe in you and your potential and will do all that we can to help you achieve your goals.

Question, comments or concerns? Leave us some feedback!

(Optional)

(Optional)